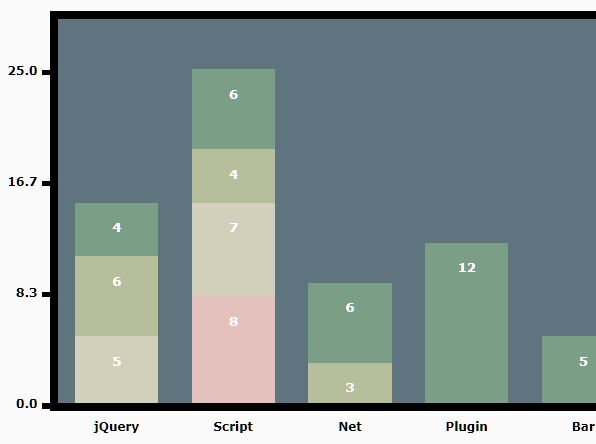
Visualize Data Through A Column Chart – jQuery drawBarChart
drawBarChart is a jQuery plugin which makes it easier to visualize your array data in a vertical bar (column) chart.
drawBarChart is a jQuery plugin which makes it easier to visualize your array data in a vertical bar (column) chart.
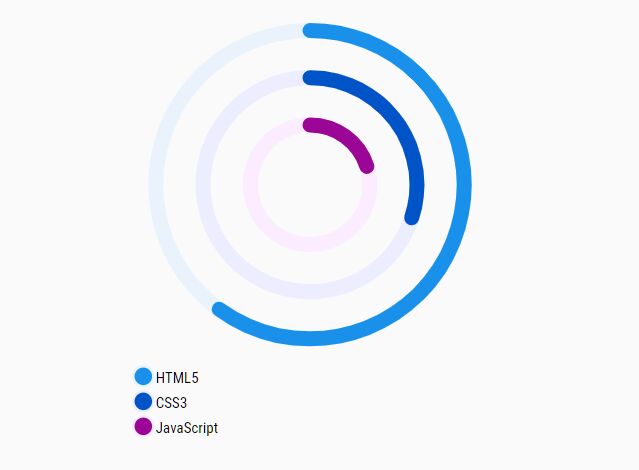
radialBar is a tiny jQuery plugin for rendering multiple SVG-based concentric circles to visualize your percentage data as a stacked ...
A simple, lightweight, dynamic, responsive, flexible, animated and cross-browser jQuery chart plugin that currently supports 5 chart types: progress, bar, ...

easy-gantt is an easy responsive, dynamic, scrollable, multi-language Gantt chart plugin designed for planning, viewing, tracking tasks in a project.

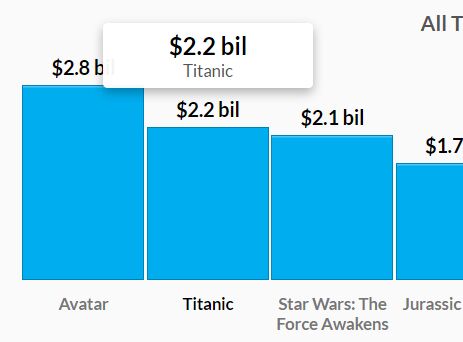
bar-chart.js is a tiny yet fully customizable jQuery chart plugin which helps you draw a plain vertical bar (column) chart ...
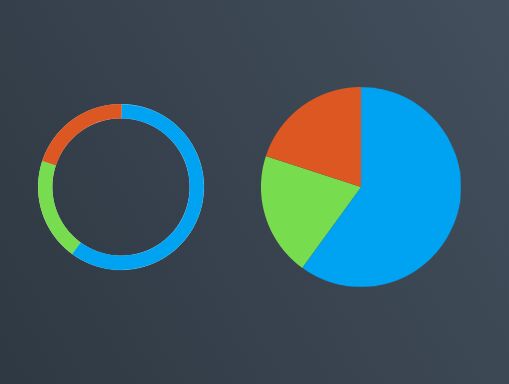
jChart is an easy-to-use jQuery plugin for rendering SVG based, vector shaped pie & donut charts that display each value ...
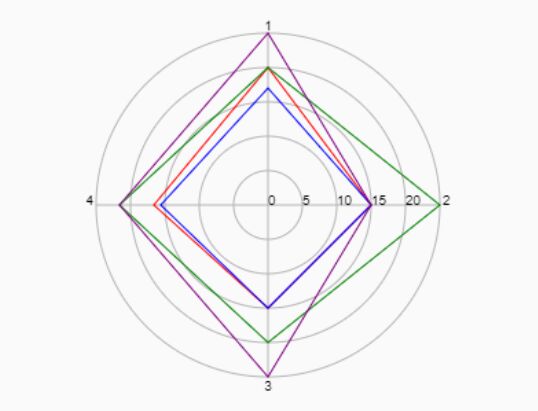
radarGraph.js is a small jQuery plugin which dynamically renders a customizable, canvas-based radar chart (radar graph, radar diagram) with legends ...
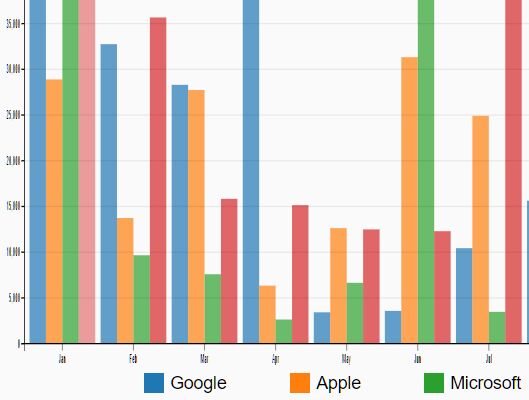
An animated, interactive, dynamic, configurable, fully responsive bar/column chart plugin built using jQuery and D3.js.
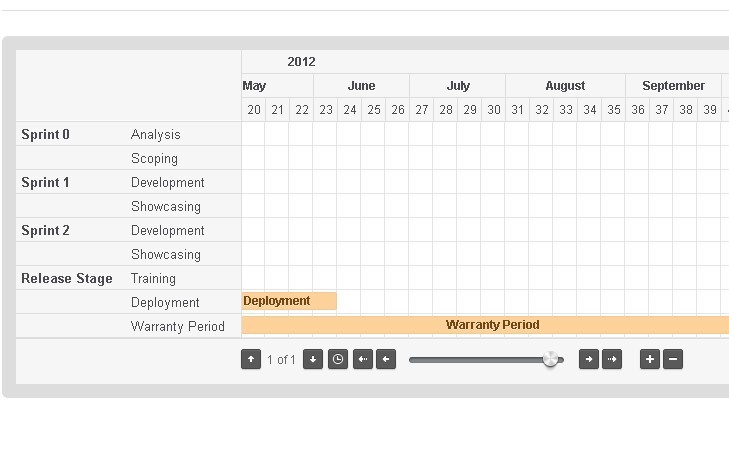
Gantt Chart is a simple jQuery plugin used for generating a dynamic Gantt Chart from JSON data, with pagination, navigation, ...

A lightweight and easy-to-use jQuery plugin to dynamically render a line chart with marks, gridlines and interlaced colors.
Free jQuery Scripts: Elevate your web development with our diverse collection of complimentary jQuery scripts. Enhance interactivity, streamline animations, and enrich user experiences effortlessly.