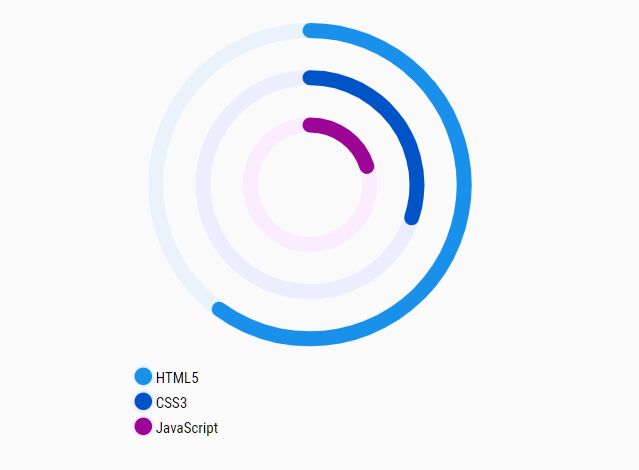
Create A Stacked Donut Chart With radialBar Plugin
radialBar is a tiny jQuery plugin for rendering multiple SVG-based concentric circles to visualize your percentage data as a stacked ...
radialBar is a tiny jQuery plugin for rendering multiple SVG-based concentric circles to visualize your percentage data as a stacked ...
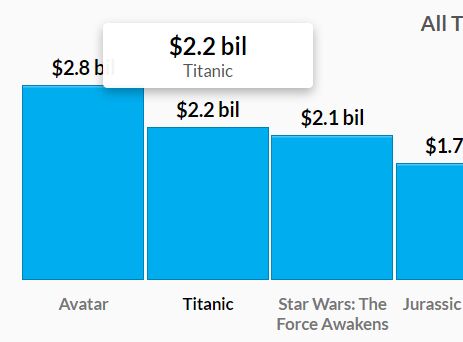
A simple, lightweight, dynamic, responsive, flexible, animated and cross-browser jQuery chart plugin that currently supports 5 chart types: progress, bar, ...

Gantt Chart is a type of bar chart that can be used to visualize your data (activities and scheduled tasks) ...

CalendarHeatmap.js is a jQuery plugin used to generate a dynamic, interactive, configurable calendar heatmap for representing time series data.

A simple-to-use jQuery plugin that uses SVG and JavaScript to draw customizable Analog Gauges or Digital Gauges on the page.
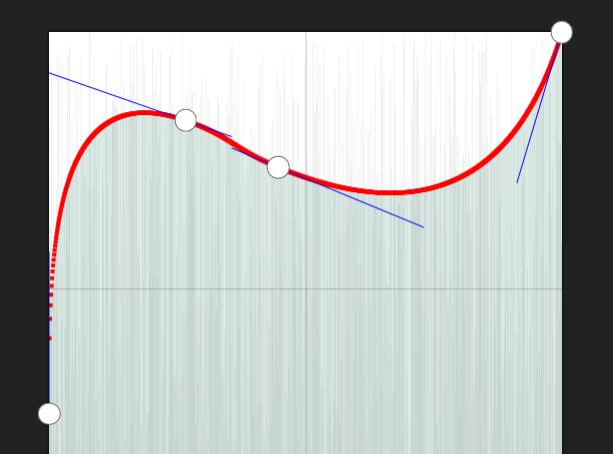
iocurve is a fully configurable jQuery plugin to create a Photoshop and Lightroom inspired Tone Curve UI where you can ...
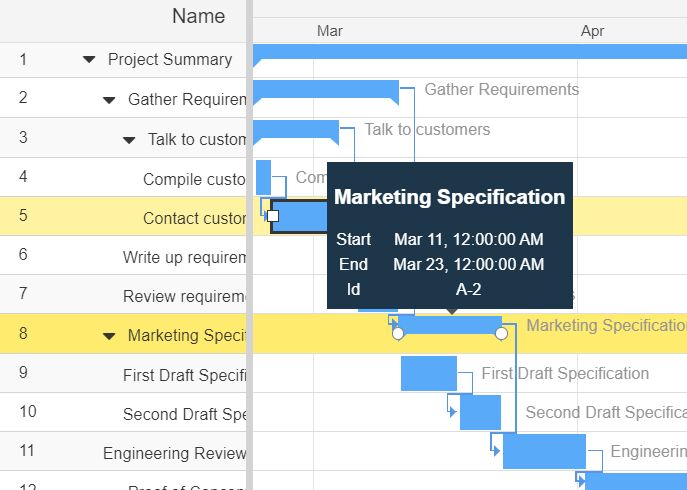
Gantt Chart is a type of bar chart that can be used to visualize your data (activities and scheduled tasks) ...
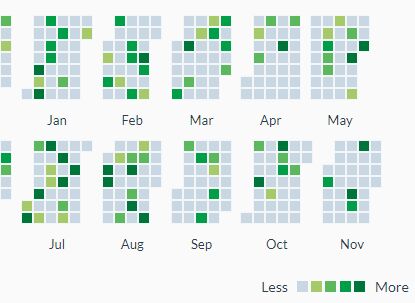
CalendarHeatmap.js is a jQuery plugin used to generate a dynamic, interactive, configurable calendar heatmap for representing time series data.
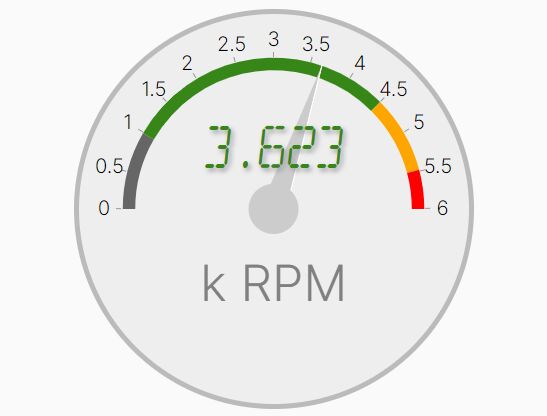
A simple-to-use jQuery plugin that uses SVG and JavaScript to draw customizable Analog Gauges or Digital Gauges on the page.
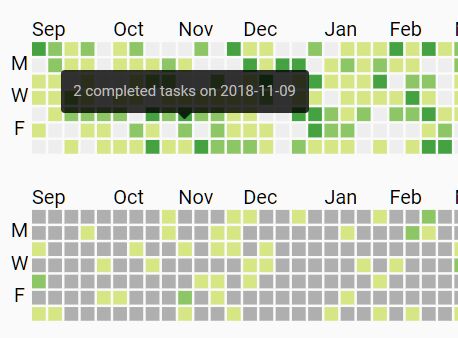
Just another jQuery plugin that renders a Github style, SVG based calendar heatmap for user profiles to represent time series ...
Free jQuery Scripts: Elevate your web development with our diverse collection of complimentary jQuery scripts. Enhance interactivity, streamline animations, and enrich user experiences effortlessly.