| File Size: | 10.7 KB |
| Views Total: | 5749 |
| Last Update: | 05/08/2017 01:54:00 UTC |
| Publish Date: | 05/07/2017 02:15:45 UTC |
| Official Website: | Go to website |
| License: | MIT |
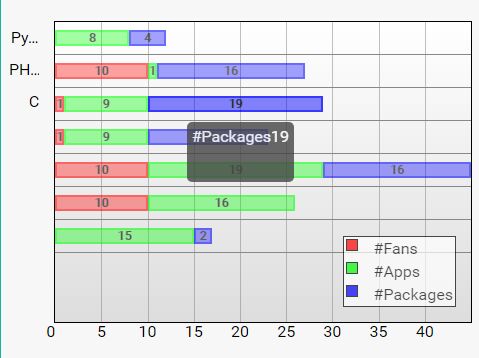
horbar, a jQuery plugin that serves as a dynamic bridge between your intricate JavaScript data and visual representation. This innovative tool redefines data visualization by seamlessly transforming your data into an animated, responsive, and horizontally-oriented Stacked Bar Chart. The amalgamation of pure JavaScript and CSS within horbar results in a lightweight yet robust solution that transcends conventional data presentation.
Horbar emerges as a versatile instrument, designed to cater to the diverse needs of developers seeking to breathe life into their data narratives. By harnessing this plugin, you’re empowered to elegantly translate intricate data patterns into an interactive visual language that resonates with users.
The essence of horbar lies in its responsive nature. Regardless of the device or screen size, the plugin ensures that your Stacked Bar Chart adapts harmoniously, preserving the visual integrity of your data presentation. This adaptability bridges the gap between desktops, tablets, and smartphones, guaranteeing a consistent and immersive experience.
The integration of animation within horbar amplifies the dynamism of your data representation. The responsive Stacked Bar Chart transitions gracefully, unveiling patterns and insights in a manner that engages users on a deeper level. This fluid visual storytelling enriches user experiences, transforming data points into meaningful narratives.
What sets horbar apart is its affinity for purity and simplicity. The combination of JavaScript and CSS speaks volumes about the plugin’s streamlined approach to data visualization. This lightweight fusion empowers developers to focus on the core data and its meaningful presentation, without being bogged down by unnecessary complexities.
By adopting horbar into your web development repertoire, you’re embracing a transformative approach to data visualization. The plugin’s ability to effortlessly transmute complex JavaScript data into a horizontally-stacked, animated, and responsive Stacked Bar Chart resonates with modern design principles. With horbar, data narratives evolve from static numbers to engaging stories, capturing user attention and fostering a deeper understanding of your content’s intricacies.